
Projects
Example Reports
VIBRATION SURVEY AT SITE OF PROPOSED DEVELOPMENT
Scope of Report
To measure levels of vibration from a compactor on a site and in a nearby residence. To comment on the measured levels in the context of expected human response and potential of structural damage.
1. INTRODUCTION
1.1 The site is a disused quarry and landfill.
1.2 The site is being covered in a layer of chalk to permit a housing development. This procedure involves use of a compactor to break up and spread chalk.
1.3 A nearby resident has complained about the vibration levels experienced in their house. The local authority are also concerned that vibration from the compaction works may cause damage to the cliff that bounds two sides of the site.
1.4 This report describes the procedure used to measure vibration levels at the site and discusses the results in terms of human response to vibration and the potential of structural damage from vibration.
2. THE SITE
2.1 An indicative plan of the site is shown in Figure 1.
2.2 The southern end of the site is currently being treated with chalk, and so measurements are only possible in this area.
2.3 The cliffs are chalk. The site is bounded to the north by a main road atop the cliff. ... (Rock Mechanics Specialists) have suggested a vibration limit of 25 mm/s (Peak Particle Velocity) for the cliffs.
2.4 Chalk Compaction Procedure
- Broken chalk is placed on the area of the site to be treated.
- One of two types of compactor is pulled over the broken chalk by a bulldozer.
- The compactors are a smooth wheeled roller and a sheepsfoot roller. (The sheepsfoot roller has spikes.)
- Pictures of the compactor and bulldozer are shown in Figure 2.
3. MEASUREMENT PROCEDURE
3.1 Vibration time histories were recorded using a Diagnostic Instruments Di2200 Portable FFT Analyser and a Bruel & Kjaer 4399 Accelerometer.
3.2 A sampling frequency of 1280 Hz was used. At this sampling frequency, each sample is 3.2 seconds long.
3.3 The accelerometer is coupled to the ground using a spiked metal plate. The accelerometer is attached to the plate using a magnet.
3.4 Four measurement locations were used. These are shown in Figure 1.
- V1: Base of cliff. Metal plate spiked into chalk ledge at ~ 0.1 m above ground level.
- V2: Top of cliff, approximately 5 m from cliff edge.
- V3: Rear bedroom on 1st floor of ..., midspan of floor.
- V4: Conservatory floor at rear of ....
3.5 During the tests, chalk compacting was undertaken at two locations - A and B - as shown on Figure 1.
3.6 Initial tests were undertaken using each compactor in turn to determine which compactor produces the greatest magnitude of vibration. This compactor was then used for the remainder of the tests.
4. RESULTS
4.1 Tests 1 and 2 determine that the smooth wheeled roller produces the highest vibration magnitude.
4.2 Test 3 was undertaken using the compactor on chalk that has already been compacted. In this situation the ground is hard. This test represents an extreme 'worst case' situation that should never normally occur.
4.3 The results of all measurements are summarised in Table 1.
Table 1: Results Summary
|
|
|
|||||||
|
(at base of cliff) |
(at top of cliff) |
(rear of house, 1st floor) |
(rear of house, ground) |
|||||
|
|
|
|
|
|
|
|
|
|
|
|
|
|
|
|
|
|
|
|
|
|
|
|
|
|
|
|
|
|
|
|
|
|
|
|
|
|
|
|
|
|
|
|
|
|
|
|
|
|
|
|
|
|
|
|
|
|
|
|
|
|
|
|
|
|
|
|
|
|
|
|
|
|
|
|
|
|
|
|
|
|
|
|
|
|
|
|
|
|
|
|
|
|
|
|
|
|
|
|
|
|
|
|
|
|
|
|
|
|
|
|
|
|
|
|
|
|
|
|
|
|
|
|
|
|
|
|
|
|
|
|
|
|
|
|
|
|
|
|
|
|
|
|
|
|
|
|
|
|
|
|
|
|
|
|
|
|
|
|
KEY FOR TEST NUMBERS:
|
|
Background Measurement |
|
|
Sheepsfoot roller operating over area B on chalk |
|
|
Smooth wheeled roller operating over area B on chalk |
|
|
Smooth wheeled roller operating over area A on hard surface (no chalk to crush) |
|
|
Smooth wheeled roller operating over area A on chalk |
4.4 The vibration magnitude was determined by taking the r.m.s. value of the peak magnitude of the vibration time history, following 1 Hz filtering (for low frequency drift) and normalisation.
4.5 The dominant frequency is determined from the FFT of the time history, produced by the Di2200.
4.6 Example waveforms are shown in Figure 4.
4.7 The results are plotted on the z-axis (foot to head) human response curves from BS 6472: 'Guide to evaluation of human exposure to vibration in buildings (1 Hz to 80 Hz)'.
4.8 The highest magnitude events measured at V1 (foundation of cliff) and V4 (foundation of house) are selected and converted to PPV's (Peak Particle Velocity) for comparison with building damage criteria using the relation:
v = a / 2p f v = peak velocity (m/s)
a = peak acceleration (m/s2)
f = frequency (Hz)
Note: The relation assumes that the signal is a sine wave. Although the actual signal is not a sine wave, it is certainly dominated one frequency (see Figure 4) so we consider that this calculation is an appropriate estimation.
4.9 These results are summarised in Table 2.
Location Maximum Peak Acceleration (m/s2) Dominant Frequency (Hz) Maximum PPV (mm/s) Base of Cliff (V1)* 0.234 31 1.2 Base of Cliff (V1) 0.114 33 0.5 Base of House (V4) 0.033 33 0.2 * Extreme example - hard surface
5. DISCUSSION
5.1 Building / Cliff Damage
5.1.1 .... (Rock Mechanics Specialists) have suggested a vibration limit of 25 mm/s (Peak Particle Velocity) for the cliffs.. The maximum PPV measured at the base of the cliff was 1.2 mm/s, under test conditions that should not normally occur. Under normal operating conditions, the maximum PPV measured was 0.5 mm/s.
5.1.2 BS 7385 'Measurement and evaluation of vibration in buildings, Part 2: Guide to damage levels from groundborne vibration' suggests values of vibration magnitude that may cause cosmetic damage to buildings subjected to transient vibration.
5.1.3 For residential buildings it suggests that this is a PPV of 20 mm/s, measured at the foundation of the building, for transient vibration sources with a dominant frequency between 15 and 40 Hz. BS 7385 suggests that for continuous vibration sources, the guide values may need to be reduced by up to 50%.
5.1.4 Therefore, we would not expect cosmetic damage to occur to this building, from this source, at vibration levels less than 15 mm/s (PPV measured at the foundation of the building).
5.1.5 The maximum PPV measured at the foundation of the building was 0.2 mm/s.
5.2 Human Response
5.2.1 The results are plotted on the z-axis (foot to head) human response curves from BS 6472: 'Guide to evaluation of human exposure to vibration in buildings (1 Hz to 80 Hz)' in Figure 3.
5.2.2 BS 6472 suggests the following criteria:
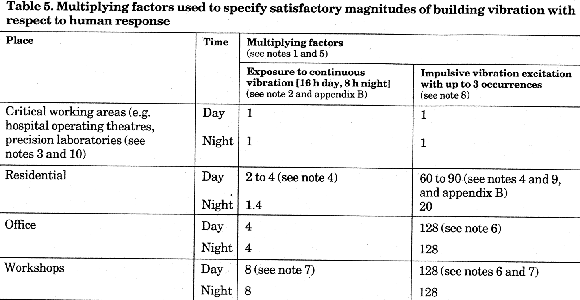
5.2.3 All of the results of the vibration measurements made in the house while compacting was being undertaken at the base of the cliff (area A) are below curve 4. BS 6472 suggests that this is an acceptable level of vibration for a residential location during the daytime.
5.2.4 The results are above curve 1.4. BS 6472 suggests that this is an unacceptable level of vibration for a residential location during the night-time.
5.2.5 However, it does make the following cautionary point:
'NOTE 4: Within residential areas people exhibit wide variations of vibration tolerance. Specific values are dependant upon social and cultural factors, psychological attitudes and expected degree of intrusion.'
5.2.6 The results are above curve 1. This is said to be the average threshold of human perception.
6. CONCLUSIONS
6.1 Structural Damage
6.1.1 The measurements made on site and in a nearby residence indicate that the probability of cosmetic damage occurring to either the cliff or to ... is very low.
6.2 Human Response
6.2.1 The results of the measurement survey indicate that the vibration is expected to be perceptible to most people.
6.2.2 BS 6472 suggests that the measured vibration levels are acceptable for a residential location during the daytime, but unacceptable during the night-time.
6.2.3 BS 6472 does not provide any suggestion of when night-time ends and daytime begins, but 07:00 is frequently used when determining noise impact to residential locations (PPG 24, BS 4142 etc).