
Projects
Example Reports
NOISE AND DUST MONITORING AT WASTE TRANSFER STATION -
Scope of Report
To measure the levels of noise and dust at the waste transfer station
1. INTRODUCTION
1.1 ... Ltd operate a waste transfer station at the ... at ..., to the north of ...,....
1.2 Civil Engineering Dynamics have been instructed to perform a survey to measure the levels of noise and dust at the site.
2. THE SITE
2.1 An indicative site plan is shown in Figure 1.
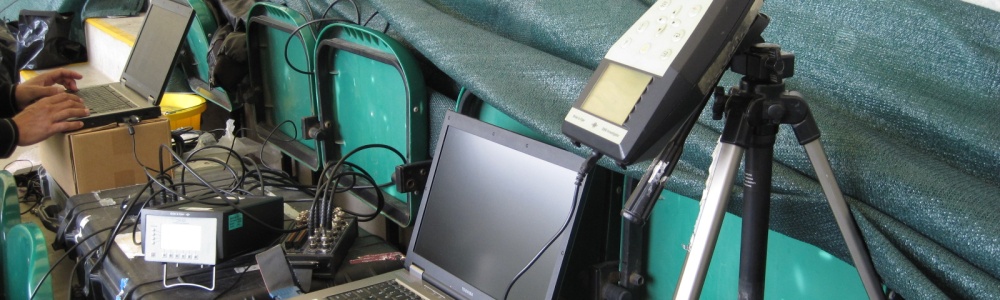
2.2 Photographs of the site are shown in Figure 2. The photographer locations are shown in Figure 1, labelled P1 to P3.
2.3 The waste is brought to site in skips, and emptied into the large metal shed that comprises the majority of the site. The lorries enter through the western door, and exit through the southern door. The yard to the south of the site is used for vehicle manoeuvre and skip storage.
2.4 The nearest neighbour is ..., occupying a unit to the east of the site.
2.5 The site operates from 07:30 to 17:30 Monday to Friday and from 07:30 to 13:30 on Saturday.
3. MEASUREMENT PROCEDURE
3.1 Two sets of measurements were undertaken. The first was undertaken from 07:30 to 17:30 on Sunday 14th May 00. This represents the background levels, i.e. the noise and dust levels that would be expected to occur during a typical working day in the absence of the waste transfer station.
3.2 The second set of measurements were undertaken over the same 10-hour period on Monday 15th May 00. The measurements over this period measure the noise and dust levels throughout one working day.
3.3 Noise
3.3.1 The noise survey procedure follows that described in BS4142 'Method for rating industrial noise affecting mixed residential and industrial areas.' The BS4142 analysis of nuisance is not performed, as the neighbours are not residential.
3.3.2 Three measurement locations (N1 - N3) are used. These are shown in the site plan - Figure 1.
3.3.3 A CEL 438/493 sound level analyser system was set up at location N1. This meter measured LAeq,15-minute and L90 continuously throughout each measurement period.
3.3.4 A Bruel & Kjaer 2260 Investigator Sound Level Meter was used to make simultaneous measurements at the other measurement locations (N2 & N3) throughout the measurement periods. This enables the noise levels for the whole measurement period to be predicted at all locations by comparison with the continuos measurements made at N1.
3.3.5 All sound level meters were calibrated before and after each measurement and any change is noted.
3.4 Dust
3.4.1 Four Casella AFC124 High Flow Sampling Pump with 7-hole sampling heads and mixed cellulose ester filters were installed around the site at locations D1 to D4 as shown in Figure 1.
3.4.2 A Casella AMS950 Portable Dust Monitor was used to determine any areas of higher dust concentration so that the AFC124’s could be located in these areas.
3.4.3 A fifth sample head and filter was installed on the site as a control.
3.4.4 A pre- and post-weighed filter method was used to determine the quantity of dust emission from the site during a 10-hour working day. The filters were weighed using a Mettler 5-digit digital balance.
3.4.5 The flowrate of each AFC124 was set to 2 litres/min at the start of each measurement period and checked at the end. Any variance is noted.
3.4.6 The temperature and relative humidity was measured at intervals throughout the measurement periods using a Solomat MPM4100.
4. RESULTS
4.1 Noise
4.1.1 The noise levels measured at N1 are shown in Figure 3.
4.1.2 The simultaneous measurements at N2 and N3 are listed in Table 1.
Table 1: Simultaneous Noise Measurements
Date/Time N1 N2 N3 LAeq,15-min (dBA) LA90 (dBA) LAeq,15-min (dBA) LA90 (dBA) LAeq,15-min (dBA) LA90 (dBA) 14/05/00 07:45 50.1 48.5 43.0 38.8 14/05/00 08:15 45.0 43.0 40.9 28.4 14/05/00 10:00 44.8 43.5 40.3 38.0 14/05/00 10:30 46.0 44.5 46.5 37.6 14/05/00 14:00 45.2 44.5 38.2 36.8 14/05/00 14:45 45.7 45.0 46.0 32.2 14/05/00 15:00 45.7 45.0 45.5 33.4 14/05/00 15:15 46.3 45.0 45.4 37.2 Average Difference from N1 (dB) + 3.4 - 6.2 + 0.6 - 10.0 15/05/00 08:15 58.6 44.5 51.6 37.6 15/05/00 08:45 60.0 45.5 51.0 38.8 15/05/00 10:45 69.3 57.0 65.2 41.2 15/05/00 11:00 68.5 57.5 62.2 39.0 15/05/00 11:45 59.0 46.0 51.0 37.4 15/05/00 14:00 64.9 46.0 63.4 38.2 15/05/00 14:15 59.6 46.5 61.1 42.8 15/05/00 14:45 65.9 55.5 57.5 47.2 Average Difference from N1 (dB) - 7.0 - 6.4 - 2.0 - 9.0
4.1.3 The LAeq,10-hour and L90 for the whole measurement period, for each location are shown in Table 2.
Table 2: Results Summary - Noise
Location Sunday Monday LAeq,10-hour LA90 LAeq,10-hour LA90 N1 48.0 44.8 66.1 53.9 N2 51.4 38.6 66.7 43.9 N3 41.0 38.4 64.1 44.9
4.1.4 It is important to note that there were frequent car pass-bys at N3 on Monday. These were cars accessing the units beyond the waste transfer station. Therefore, the noise measured at N3 on Monday is not solely due to the waste transfer station. It is not possible to discern to what extent the cars have inflated these values.
4.1.5 It is also important to note that measurements within the site boundary. The shared boundary with is a high metal wall (see Figure 2). Therefore, the noise levels at the façade of the unit can be expected to be some 10 dB lower than those measured in the yard.
4.2 Dust
4.2.1 Given the difference between the filter weights before and after survey, a measurement period of 10 hours, and a flowrate of 2 litres per minute, the dust weight per unit volume is established.
4.2.2 The dust levels on the site are very low. The quantity of dust collected was below the handling error of the measurement procedure in all locations except D4.
4.2.3 A very harsh estimate can be derived by adding the handling error to the value obtained for the D4 monitor. This yields a dust level of less than 1.2 mg/m3 for a 10-hour period. Dust levels at the other monitors can be expected to be considerably less.
4.2.4 The higher levels at D4 are probably due to vehicles passing out of the site. When the yard is fully concreted this level can be expected to significantly reduce.
4.3 Environmental Variables
4.3.1 The weather on both days was hot and dry. Monday afternoon yielded a light breeze from the south. There was considerable fog around dawn on Sunday morning which had cleared some time before the measurements started.
4.3.2 Both days started with the temperature of approximately 15-20ºC around 07:00, rising to approximately 25ºC by mid morning, and holding between 25 and 29ºC for the remainder of the measurement period.
5. SUMMARY
5.1 Noise is around 66 dBA LAeq,10-hour, and on average 48 dBA LA90, for a working day at the waste transfer station. This contrasts with background noise measurements of 41 – 51 dBA LAeq,10-hour, and on average 41 dBA LA90.
5.2 It is important to note that measurements within the site boundary. The shared boundary with is a high metal wall (see Figure 2). Therefore, the noise levels at the façade of the unit can be expected to be some 10 dB lower than those measured in the yard.
5.3 Dust levels are very low. Levels are highest at the western boundary. Here, a very harsh estimate of the dust level is less than 1.2 mg/m3.
5.4 We understand that the site has been operating for over a year without complaint from any neighbours. The measured noise and dust levels indicate that this to be expected.